- Joined
- Aug 2, 2021
- Messages
- 5
This article will help you expand your first project with attribute-based geometry styles, filters and the possibility to export data to different data formats.
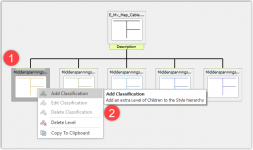
To do add a classification:
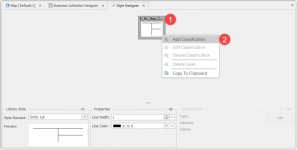
The classification choices depend on the field types as configured in the business collection.
Here Attribute Lookup is used, follow the following steps:
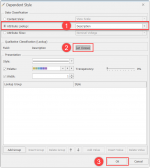
On the next screen:
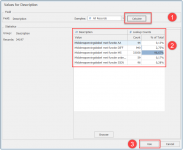
On this screen you can:
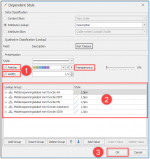
Lookup Groups can be configured and styled, with additional groups and values if needed. Additional classifications can also be built upon each other to create a hierarchy style in the style configuration.
To do this you:
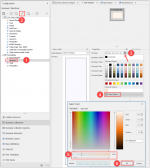
Next step is to style the municipalities with a transparent colour.
Just follow the steps indicated in the image below.
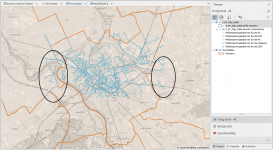
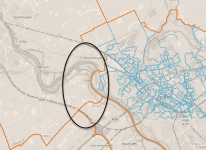
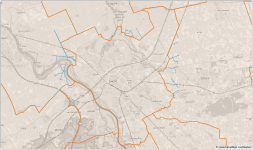
Now we have an overview of the map, looking at the municipality “Zwolle” where the cables are located. Some cables are located outside of Zwolle though.
Explanation of the picture below: the orange lines are the municipal boundaries, the blue lines are the cables and the black ovals indicate where cables are outside the boundary of Zwolle.
How to set a filter for Municipality = Zwolle.
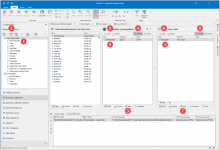
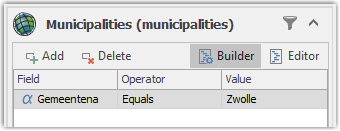
In the municipality lookup table, a filter is set on Gemeentena equals Zwolle. Only 1 record will be found in the municipality dataset with that value.
In the business collection table, a filter is set on Municipality with the operator Has a value.
Now only cables which have the attribute Zwolle in their municipality table field will be looked up and selected in the business collection.
Cables are no longer shown in the black oval, they are filtered out.
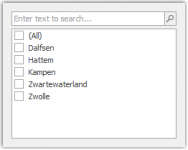
Filtered result: only one value in Municipality (in this case Zwolle).

Unfiltered results, more than one value in Municipality.
When you browse the collection, you will see only the objects that are passed by the filter.
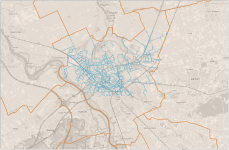
On the map, only cables interacting with the municipality Zwolle will be displayed now.
Likewise, the filters in the business collection can be set to get the opposite selection of cables (only cables outside the municipality ‘Zwolle’)

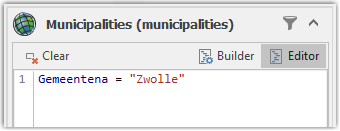
You can add or edit fields using the editor mode. If you right click on the business collection and use Add field using Expression, the editor mode opens.
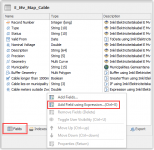
Suggestions and additional expressions will be shown automatically when you start typing, so you don’t need to know exactly what to type in the editor.
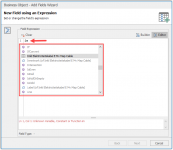
For now, we will add a buffer of 1 meter to the cables, which is a multi-polygon type; the field type is decided automatically, based on the output type of the expression. You can also use these newly created polygons for further (spatial) analysis in the business collection.
Create the expression.
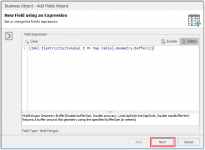
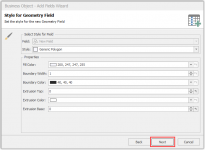
A style is automatically generated, you can edit the style here if you want.
Give the new expression field a name.
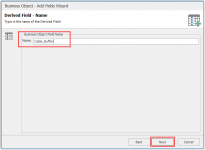
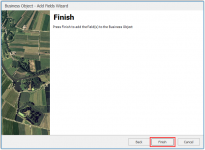
Click Finish.
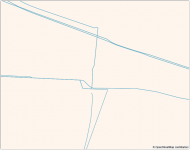
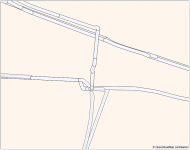
Go to the Map tab, zoomed in you can easily see the difference in appearance. The first image are just the cables, the second image are the cables with the 1-meter buffer.
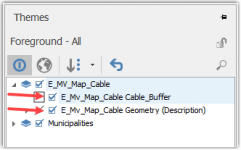
Just toggle the styles in the Themes tab to get the images above.
If you browse a collection, you can immediately export the results, as either the whole result list or only the selection (which is 1, selected in blue, in the example above).
The available formats to export to are shown in the drop-down menu. The choices depend on your business collection and source collections that are added in the project file.
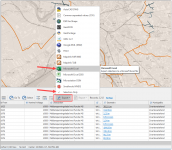
For example, a business collection without any geometry, cannot be exported to a shapefile. And you can only export to a SQL Server database, when there is a SQL connection available as feature source.
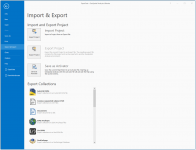
Exporting from the menu is similar, but there are more options available. You can import and export a project file or generate an activator file, to save the current map extent.
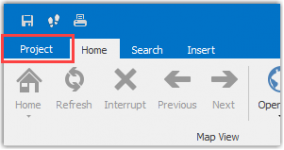
To go to the menu, click in left hand top corner on Project tab.
You can choose to export the entire business collection, or only the data shown on the current map extent. More dialog options will appear to further specify the export options.
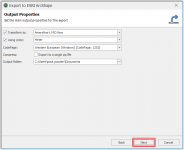
Set the options so the export is to your liking and click Next.
Prerequisites:
- Latest version of Professional or Ultimate edition of the desktop product
- Configured location of the project store to save your project file
- File based data sources (GeoPackage and ESRI Shapefile)
- Download the sample project and data
Recommended:
- Completed the first article: Creating your first project
Step 1: Configuring the geometry style based on an attribute
We already gave the E_MV_Map_Cables a solid black colour style, but you can also style objects based on their attributes by adding a classification.To do add a classification:
- Right click on the style
- Click on Add Classification

The classification choices depend on the field types as configured in the business collection.
Here Attribute Lookup is used, follow the following steps:
- Select the radio button before Attribute Lookup and select Description from the dropdown list
- Click Get Classes
- Click OK

On the next screen:
- Click Calculate
- Look at the calculated values of Description
- Click Use

On this screen you can:
- Adjust the Palette colours, Width and Transparency of the style
- Optionally adjust the Style of the individual Lookup Groups
- Click OK to leave this screen

Lookup Groups can be configured and styled, with additional groups and values if needed. Additional classifications can also be built upon each other to create a hierarchy style in the style configuration.
To do this you:
- Right click the classification group that you want to extend
- Click on Add Classification (the next steps are described above)

Next step is to style the municipalities with a transparent colour.
Just follow the steps indicated in the image below.

Now we have an overview of the map, looking at the municipality “Zwolle” where the cables are located. Some cables are located outside of Zwolle though.
Explanation of the picture below: the orange lines are the municipal boundaries, the blue lines are the cables and the black ovals indicate where cables are outside the boundary of Zwolle.

Step 2: Adding data filters
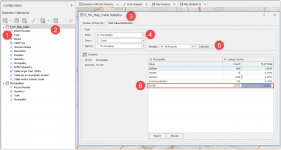
To see the number of cables that are in the municipality of Zwolle, you can do a statistics check. You do this as follows:- Select the business collection: E_Mv_Map_Cable
- Click the Collection Statistics button (a pop-up appears)
- Select the Field Value Distribution tab
- Select the Field: Municipality
- Click on Calculate
- See the result for Zwolle in this row

Builder mode
For further analysis of this collection, you can add filters to the business collection. Or, if you want or have to modify the data, you can add expressions.How to set a filter for Municipality = Zwolle.
- Select the collection E_Mv_Map_Cable
- Click on the Configure button
- Click on Filter in the column Municipalities (municipalities)
- Click on the Builder button
- Click on Add
- Select the field Gemeentena
- Click on Filter in the column E_Mv_Map_Cable
- Click on the Builder button
- Click on Add
- Select the field Municipality, select the operator Has a value

In the municipality lookup table, a filter is set on Gemeentena equals Zwolle. Only 1 record will be found in the municipality dataset with that value.
In the business collection table, a filter is set on Municipality with the operator Has a value.
Now only cables which have the attribute Zwolle in their municipality table field will be looked up and selected in the business collection.
Cables are no longer shown in the black oval, they are filtered out.

Filtering in Business Collections
Any filters or expressions set in the business collection are only applicable for that specific business collection. The source data is never actually changed.Filtered result: only one value in Municipality (in this case Zwolle).

Unfiltered results, more than one value in Municipality.

When you browse the collection, you will see only the objects that are passed by the filter.

On the map, only cables interacting with the municipality Zwolle will be displayed now.
Likewise, the filters in the business collection can be set to get the opposite selection of cables (only cables outside the municipality ‘Zwolle’)


Editor Mode
Instead of the builder mode, which is suited for quick lookup selections, the editor mode is shown below. The editor mode allows you to make more advanced filters and calculations. You can also first use the builder mode, and then switch to editor mode to see how the filter has been translated in editor mode.

You can add or edit fields using the editor mode. If you right click on the business collection and use Add field using Expression, the editor mode opens.

Suggestions and additional expressions will be shown automatically when you start typing, so you don’t need to know exactly what to type in the editor.

For now, we will add a buffer of 1 meter to the cables, which is a multi-polygon type; the field type is decided automatically, based on the output type of the expression. You can also use these newly created polygons for further (spatial) analysis in the business collection.
Create the expression.

A style is automatically generated, you can edit the style here if you want.

Give the new expression field a name.

Click Finish.

Go to the Map tab, zoomed in you can easily see the difference in appearance. The first image are just the cables, the second image are the cables with the 1-meter buffer.


Just toggle the styles in the Themes tab to get the images above.

Step 3: Exporting your data
There are multiple ways of exporting your data, either from the result list, or from the export option in the menu.If you browse a collection, you can immediately export the results, as either the whole result list or only the selection (which is 1, selected in blue, in the example above).
The available formats to export to are shown in the drop-down menu. The choices depend on your business collection and source collections that are added in the project file.

For example, a business collection without any geometry, cannot be exported to a shapefile. And you can only export to a SQL Server database, when there is a SQL connection available as feature source.
Exporting from the menu is similar, but there are more options available. You can import and export a project file or generate an activator file, to save the current map extent.
To go to the menu, click in left hand top corner on Project tab.

You can choose to export the entire business collection, or only the data shown on the current map extent. More dialog options will appear to further specify the export options.

Set the options so the export is to your liking and click Next.

Last edited by a moderator:
