- Joined
- Aug 2, 2021
- Messages
- 5
This article will help you setup your first project and explore the basic data shaping, query and visualization capabilities of the GeoSpatialAnalysis application (or GSA application).
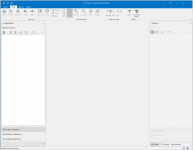
Your new project:
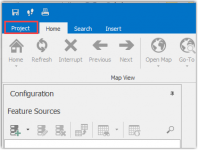
To make sure that you won’t lose your work, save the project in the Project Store. Click on Project in the top left-hand corner.
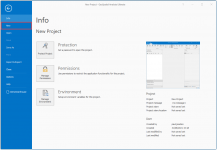
Click Save As, give your project a name and click Save.
The project is now saved in your Project Store.
Now that you have your project set up it's time to add some data and start exploring, shaping and visualizing. Unzip the file-based data sources ESRI ArcShape (countries.dbf, countries.shp and countries.shx) and the Microsoft Excel (CountryInhabitants.xls), you can download from this article and place them in a data directory on your computer.
Note about ESRI Shape
Adding the Countries.shp file as a Feature Source (coordinate system for this file is WGS 84 with EPSG: 4326)
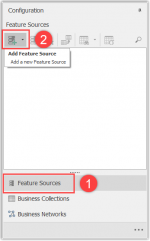
Add a feature source to your project.
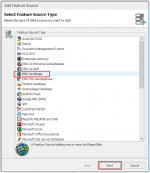
Select the Type of source, in this case it is: ESRI ArcShape, and click Next.
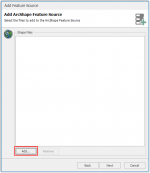
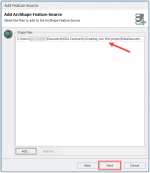
Click Add.
Select the data source you downloaded earlier.
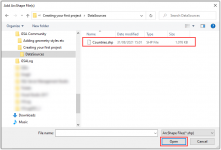
Now you see that the data source is selected.
Click Next.
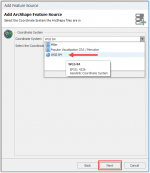
Select the correct coordinate system, in this case WGS84.
Click Next.
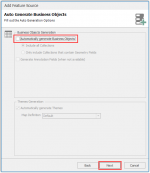
It's a good practice not to auto generate Business Objects right away. It’s better to get familiar with the data source, so you know which tables you want to use in your project.
Auto generation will save you work in the future when you are more familiar with the product.
So untick the box Automatically generate Business Objects and click Next.
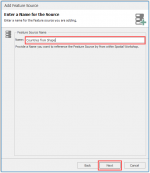
Name your source Countries from Shape and click Next and on the next screen click Finish.
Explore the structure of the source by clicking on the arrows.
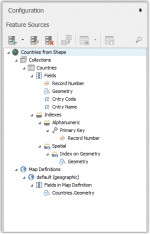
You can see the following parts in the feature source:
Adding the Excel-file is quite similar to adding the shape file. As there is no possibility to store geometrical fields in Excel the selection of the coordinate system will not appear.
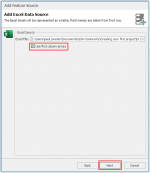
When adding the Excel-file you can select to use the first column as primary key, do this only if you are sure that the first column contains unique values. If you are not sure don’t tick the box, in this case we don’t tick it.
Note about Excel
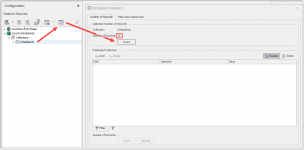
Explore the data sources with the Statistic and Browse functionalities to determine which tables you want to use for your Business Objects. Statistics will give insight in the number of records in the source table and field value distribution per specified field from the selected source table.
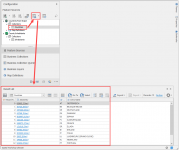
Browse or Browse filtered will give you the actual content of the source table.
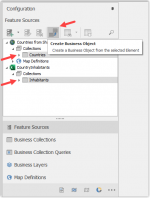
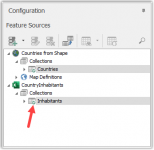
You can see the green check icon when the source table is being used in the Business Collections.
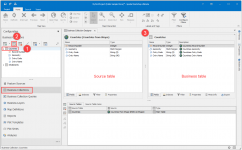
Now we can go to the Business Collections overview and start shaping our newly created Business Objects.
Business Objects
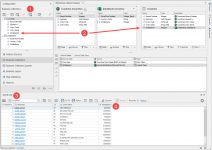
We are going to integrate the data from Excel with the data from the ESRI Shape file by establishing a relationship (also known as join) between the Countries table and the Inhabitants table. The result will give us the information about the number of inhabitants in the same Business Objects as the information about the location of the countries.
Select the Countries Business Object and go to the add source table wizard.

In the first menu
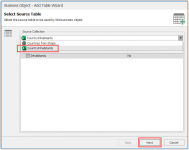
In the next menu
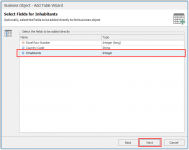
In the next menu select the type of the relationship.
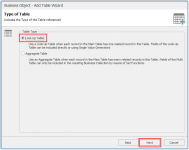
In this menu
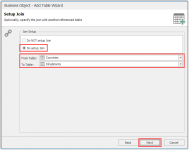
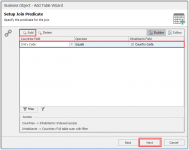
Next step is configuring the mutual field to set up the relationship, this can be done alphanumeric, spatial or a combination of the two. In the example the field Country Code is mutual in the two sources, so we use this field to join the tables.
You do this as follows:
When the wizard is finished you will see the related table in the middle of the screen and a new field added to the Countries Business Object.
To see the results:
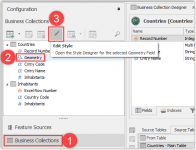
The Style Designer is used to give the selected geometry field a specific style. The application provides a default set, but it is also possible to create and import your own styles and create styles dependent on context like view scale or attribute values. For now, we will choose the default Municipality style for this geometry.
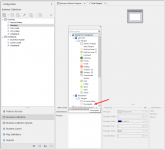
Now we have the integrated Business Object Countries and we styled its geometry field with the default Municipality style, we are ready to put it on a map.
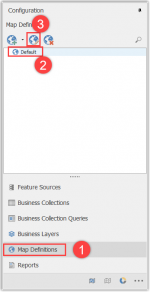
In the overview tab you will see the Geometry from Countries that is ready to be used on the map.
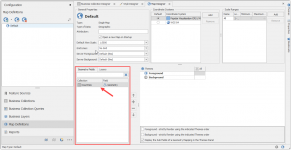
To add the style to the map, follow these steps:
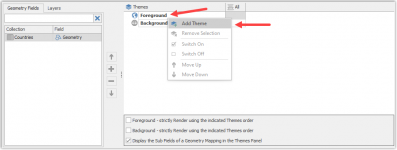
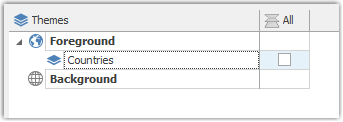
Changing names
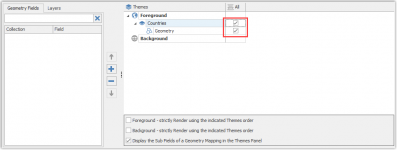
You can add the geometry of Countries to the map by selecting it from the Geometry Field tab, selecting the theme and clicking on the plus icon.
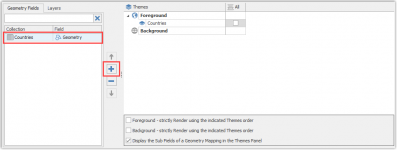
Select the All option in the Scale Ranges to present the geometry on all levels.
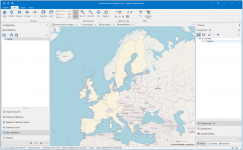
Now you can open the map from the Home ribbon and view the results by navigating on the Default map and clicking on the countries geometries to view it's properties.

The opened map.
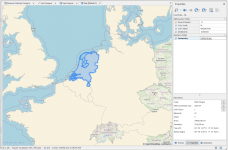
Details of a country.
Prerequisites:
- Professional or Ultimate edition of the GSA application
- Configured location of the project store to save your project file
- File based data sources (ESRI ArcShape and Microsoft Excel), download here.
Step 1: Starting a new project and opening your data sources
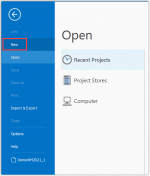
Start the application, go to the Project tab and select New, to make a new Project.
Your new project:

To make sure that you won’t lose your work, save the project in the Project Store. Click on Project in the top left-hand corner.

Click Save As, give your project a name and click Save.
The project is now saved in your Project Store.

Now that you have your project set up it's time to add some data and start exploring, shaping and visualizing. Unzip the file-based data sources ESRI ArcShape (countries.dbf, countries.shp and countries.shx) and the Microsoft Excel (CountryInhabitants.xls), you can download from this article and place them in a data directory on your computer.
Note about ESRI Shape
Although you will see only the .shp-file when opening this data source, the .dbf and .shx also need to be in the same directory as they contain specific parts of the stored data.
If you are interested in the spatial data from this source you will need to know the coordinate system in which the data has been stored. This information is usually provided by the maker of the data source.
Adding the Countries.shp file as a Feature Source (coordinate system for this file is WGS 84 with EPSG: 4326)
Add a feature source to your project.
- Select Feature Sources
- Click on the Add Feature Source button

Select the Type of source, in this case it is: ESRI ArcShape, and click Next.

Click Add.

Select the data source you downloaded earlier.

Now you see that the data source is selected.
Click Next.

Select the correct coordinate system, in this case WGS84.
Click Next.

It's a good practice not to auto generate Business Objects right away. It’s better to get familiar with the data source, so you know which tables you want to use in your project.
Auto generation will save you work in the future when you are more familiar with the product.
So untick the box Automatically generate Business Objects and click Next.

Name your source Countries from Shape and click Next and on the next screen click Finish.

Explore the structure of the source by clicking on the arrows.

You can see the following parts in the feature source:
| Collections | Overview of the data source tables |
| Map Definitions | Overview of all geometrical fields from the data source |
| Fields | Overview of the fields within the selected data source table |
| Indexes | Overview of the alphanumeric and spatial indexes for the selected data source table |
| Alphanumeric Field | Indicated by a selected column icon |
| Geometrical Field | Indicated by single or multi point, line or polygon icons |
| Primary key | Indicated by the key icon |
Adding the Excel-file is quite similar to adding the shape file. As there is no possibility to store geometrical fields in Excel the selection of the coordinate system will not appear.
When adding the Excel-file you can select to use the first column as primary key, do this only if you are sure that the first column contains unique values. If you are not sure don’t tick the box, in this case we don’t tick it.

Note about Excel
Excel data source is actively checked for mutations, when you adjust the content of the Excel file the results will be visible in the application.
Explore the data sources with the Statistic and Browse functionalities to determine which tables you want to use for your Business Objects. Statistics will give insight in the number of records in the source table and field value distribution per specified field from the selected source table.

Browse or Browse filtered will give you the actual content of the source table.

Step 2: Creating and shaping Business Objects
Now that we know that we want to use the Countries table from ESRI Shape and Inhabitants from Excel we can promote those tables to Business Collections. Select the two tables (hold the Ctrl-key to perform a double selection and press the Create Business Object icon).
You can see the green check icon when the source table is being used in the Business Collections.

Now we can go to the Business Collections overview and start shaping our newly created Business Objects.
- Select the just created Countries Business Object.
- Press the configure icon to enter the data shaping menu.
- The Business Collection Designer.

Business Objects
You can see a business object as another layer on top of the source table. In this layer you can change existing fields, create derived fields and integrate other source tables. The fields can be used directly or aggregated.
You can create new objects with these fields that you can use for reporting, analytics or visualization without changing the actual source.
The application will determine the most efficient way of returning the data from the selected data sources based on the choices you made in the configuration of the business object
We are going to integrate the data from Excel with the data from the ESRI Shape file by establishing a relationship (also known as join) between the Countries table and the Inhabitants table. The result will give us the information about the number of inhabitants in the same Business Objects as the information about the location of the countries.
Select the Countries Business Object and go to the add source table wizard.

In the first menu
- Select the Excel-sheet as the Source table.
- Click Next.

In the next menu
- Select the field Inhabitants.
- This field will be added to the Business Object automatically after the wizard menus are completed.
- When we want to add another field from the related table, we can always do this in the Business Object configuration without running the wizard again.
- Click Next.

In the next menu select the type of the relationship.
- In our case we will use Look Up Table.
- Click Next.

| Look Up Table | Used for cases where you want to use the actual value of the field from the related table, it can be either one on one (single lookup), one to many (multiplicity) or forced one on one |
| Aggregate Table | Aggregate Table is used when the related table will have multiple results (one to many) in the relationship and you want to add aggregated values like Count, Gather, Min, Max, Mean and Sum |
In this menu
- Select Do setup Join.
- Check the From Table and To Table fields to make sure that the relationship, we want to build, is correct.

Next step is configuring the mutual field to set up the relationship, this can be done alphanumeric, spatial or a combination of the two. In the example the field Country Code is mutual in the two sources, so we use this field to join the tables.
You do this as follows:
- Click Add
- Select in the left-hand column the field Cntry Code
- Select operator Equals
- Select in the right-hand column the filed Country Code
- Click Next

When the wizard is finished you will see the related table in the middle of the screen and a new field added to the Countries Business Object.
To see the results:
- Browse the Business Collection
- Check that the Inhabitants field is in the Countries collection
- Look in the result list
- Check the column Inhabitants

Step 3: Styling the geometries
For our final step we will add styling to the countries Business Object geometry field and add it to a map. Select the geometry field from the Business Object, in our case it's a multi polygon, and open the style designer.
The Style Designer is used to give the selected geometry field a specific style. The application provides a default set, but it is also possible to create and import your own styles and create styles dependent on context like view scale or attribute values. For now, we will choose the default Municipality style for this geometry.

Now we have the integrated Business Object Countries and we styled its geometry field with the default Municipality style, we are ready to put it on a map.
- Go to the Map Definitions and
- Select the Default map.
- Click on the configure button

In the overview tab you will see the Geometry from Countries that is ready to be used on the map.

To add the style to the map, follow these steps:
- Create a new Theme in the Foreground of the map
- Right click on the Foreground
- Click on Add Theme
- Change the name to Countries.


Changing names
If you want to change the name of the Theme later, you can use the F2 key while the Theme is selected to enter the name edit mode. It will also work in other parts of the application.
You can add the geometry of Countries to the map by selecting it from the Geometry Field tab, selecting the theme and clicking on the plus icon.

Select the All option in the Scale Ranges to present the geometry on all levels.

Now you can open the map from the Home ribbon and view the results by navigating on the Default map and clicking on the countries geometries to view it's properties.

The opened map.

Details of a country.

Attachments
Last edited:
