What's new

Welcome to the GSA Community!

This is the Official User Community for GE's GeoSpatial Analysis products. By registering with us, you'll be able to discuss, share and private message with other members of our Community.
Registration is currently only allowed with a personalized invitation code, which you might have received previously. If you haven't got one:
please get in touch with your GE contact person or your regional moderator(s): see FAQ.

SignUp Now!

GSA 5.2.8. How to report a run-up (dashboards?)

Björn Schaefer

Member
Confirmed GSA Customer
Joined
Oct 26, 2020
Messages
91
Hi all

Our CEO wants to have a daily "dashboard" for several areas:
the area ist defined by GIS and contains Buildings.
Out of the ERP System (oracle based) there is a view, containing contracts, those are matchable to the buildings

each contract has a start date.

the wanted report for CEO shall be presented by mail (link) each morning, so that this would be a task at GSA Server

So far, so good, but CEO wouldn't be CEO, if there was no special requirement:

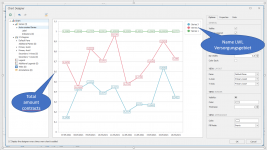
He would like to see a run-up of contracts within that report per area, so each area may show an increasing list (one row per day) with "todays" contracts (contract per day) and a total amount of contracts...

in example:
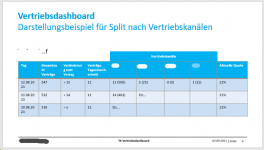
1630919266471.png

is there any possibility to automate something like this?
 

Joery Korobejnik

Moderator - Spatial Eye
Confirmed GSA Customer
Joined
Nov 26, 2020
Messages
35
Hi Björn,

Just to set the expectations right, if we are able to do this with GSA it will be a daily email with a .pdf report. I will try to create an example tomorrow to see if this is possible.

kind regards,

Joery Korobejnik
 

Björn Schaefer

Member
Confirmed GSA Customer
Joined
Oct 26, 2020
Messages
91
Thanks in advance.... You may use the attached file (shortend to necessary columns "Erstellungsdatum" and "LWL Versorgungsgebiet Name"...

Report via Mail per day would be great!

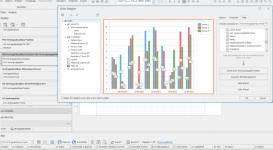
I took a look to the report Designer, but I do not really understand, how to use it... I guess, I need to group and sum up the data in any way, in order to create one diagram per group "LWL Versorgungsgebiet Name"....
But no matter what I try here:
1631002697833.png

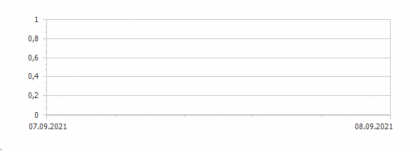
the resulting pdf is just like this:

1631002750217.png
 

Attachments

  • Vertrag_Versorgungsgebiet.zip
    142.6 KB · Views: 0

Björn Schaefer

Member
Confirmed GSA Customer
Joined
Oct 26, 2020
Messages
91
By the way: this will be needed as an analytic report, not as a business report, if this is important (or am I forced to generate more complex business objects?)
 

Björn Schaefer

Member
Confirmed GSA Customer
Joined
Oct 26, 2020
Messages
91
Maybe sth. like this could be suitable, too...
(i don't know, what the shown labels / numbers want to tell me... by starting a report, it is like shown above (empty diagram)
1631009255552.png
 

Joery Korobejnik

Moderator - Spatial Eye
Confirmed GSA Customer
Joined
Nov 26, 2020
Messages
35
Hi Björn,

I did not forget you, some other things came in between. I will work on it on monday.

regards,

Joery
 

Björn Schaefer

Member
Confirmed GSA Customer
Joined
Oct 26, 2020
Messages
91
No Problem :)
I'll keep on trying to find a solution too :)

Maybe a hint for upcoming features for GSA: GSA means geospatial Analytics, but not necessarely geospatial presentation of Data is needed in any case:

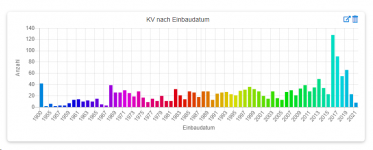
Perhaps you may start an internal discussion, if something like this (nothing to do with GSA, but automatically generated in a Web - Frontend) would be a great function for GSA:

This one is showing Assets, orderd by Date "Einbaudatum". Statistics like this are groupable in a thematic Dashboard. Something like this is missed within GSA (GSA Lite) as far as I know.

1631252680581.png
 

PeerBittner

Member
Confirmed GSA Customer
Joined
Oct 22, 2020
Messages
16
Hi guys,

super interesting topic! Many of our departments request "dashboard-ish" solutions from us, with which they can query the "status of affairs" on a daily basis.
At the moment I am using the GSA as a "data configurator / exporter" and jupyter notebook / dashboard to create the dashboard.
I think, this is definitely an adequate approach. But if the whole "dashboard creation thing" gets integrated in the GSA - count me in! ;)

Cheers,
Peer
 
Top