What's new

Welcome to the GSA Community!

This is the Official User Community for GE's GeoSpatial Analysis products. By registering with us, you'll be able to discuss, share and private message with other members of our Community.
Registration is currently only allowed with a personalized invitation code, which you might have received previously. If you haven't got one:
please get in touch with your GE contact person or your regional moderator(s): see FAQ.

SignUp Now!

GSA 5.2.7. Pro Comparasion and presentation of several Date - Fields

Björn Schaefer

Member
Confirmed GSA Customer
Joined
Oct 26, 2020
Messages
91
Hi everybody

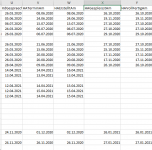
I'd like to generate an analytic map, showing different states from Objects: There is a datasource, containing 5 columns, each showing a date, some rows / cells are empty.
1623393174807.png

the workflow runs from left Column to the right one, so KdGespraech ist the first step, HAvollfertigAm the last one.

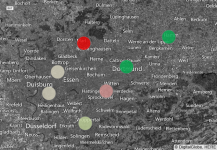
The analytic map should show only one geometry (with different Style-Options like from red to green points)

Is there any simple way to create something like that?

thanks in advance!
 

Frank Pistorius

Spatial Eye
Confirmed GSA Customer
Joined
May 26, 2020
Messages
36
Hi Björn,

This can indeed be done by introducing an additional field on your business collection that represents the active stage.

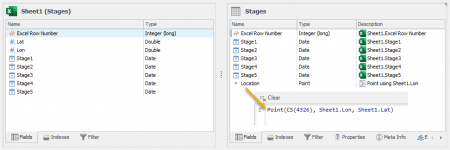
I've set up an excel sheet with similar information as you have.

Stages01.png

In this case, I've added additional lat/lon information to be able to place the elements on the map later on.
In your situation, I presume the location of the data comes from somewhere else.

I've used this source collection (sheet) in a Stages business collection and instead of picking up the lat/lon information from the sheet, I've created a true location field using the Point() expression. With the data being in WGS84, I've indicated the CS to be 4326.

Stages02.png

This is basically a simple starting point.

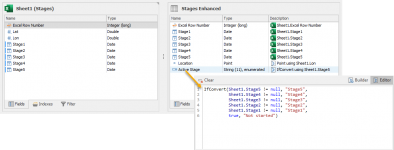
I've left this collection as is and created another collection (Stages Enhanced) to show the expression to use to determine the active stage.

Stages03.png

With this expression in place, the data looks as is shown below:

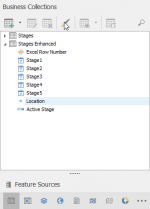
Stages04.png

Here we can see that the correct active stage is determined. With the active stage known, we can now use it to set up a style dependency.

Stages05.png

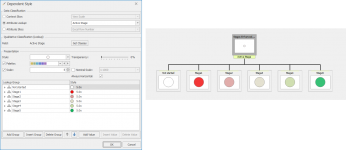
In the style designer, I've set up a qualitative dependency on the Active Stage field as shown below.

1623399562232.png

Rendering the data shows the styles dependent on the active stage:

1623399602355.png

In case you want to do use this in Analysis, I would suggest to still create the additional Active Stage field at the business level.
By making the additional information available early on, it is available in more places as is shown here.

Hopefully, this helps you further in setting up the Active Stage for your project.
Attached, you'll find a self-contained project used in the above example.

Regards,

Frank
 

Attachments

  • AnalysisStagesStyles.zip
    11.6 KB · Views: 0
Last edited:

Björn Schaefer

Member
Confirmed GSA Customer
Joined
Oct 26, 2020
Messages
91
Hi Frank

many many thanks for this description! You're right, a position is given, but not included within the snapshot shown above.
Your idea to use the "unset" validator (!=null) is the jumping point, 'cause I thougt about comparing date formats (older / younger than), but this would make it much more complex.

Have a great weekend!
 
Top