- Joined
- Oct 26, 2020
- Messages
- 93
Hi everybody
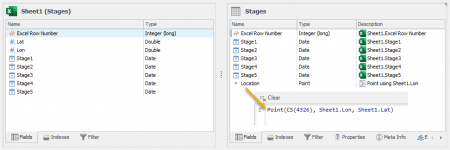
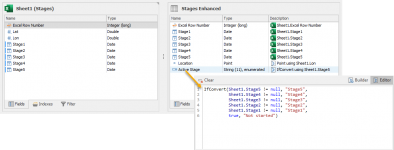
I'd like to generate an analytic map, showing different states from Objects: There is a datasource, containing 5 columns, each showing a date, some rows / cells are empty.
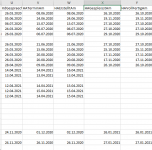
the workflow runs from left Column to the right one, so KdGespraech ist the first step, HAvollfertigAm the last one.
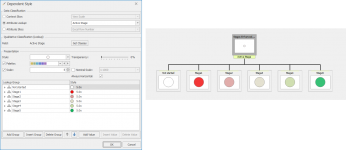
The analytic map should show only one geometry (with different Style-Options like from red to green points)
Is there any simple way to create something like that?
thanks in advance!
I'd like to generate an analytic map, showing different states from Objects: There is a datasource, containing 5 columns, each showing a date, some rows / cells are empty.

the workflow runs from left Column to the right one, so KdGespraech ist the first step, HAvollfertigAm the last one.
The analytic map should show only one geometry (with different Style-Options like from red to green points)
Is there any simple way to create something like that?
thanks in advance!


